Roofing Leads Case Study: What the Numbers Leave Out
A roofing leads case study almost always reports one number: how many leads a campaign produced. That is the number the whole genre is built on. A client, a channel, a chart, and a lead count with a plus sign on it. The search behind the page is asking for something fair: proof that a lead source works before money goes into it. Lead volume cannot answer that. The part every one of those pages leaves out is whether the leads became booked, paid jobs. This page is the checklist for reading one before you believe it.
What a roofing leads case study actually measures
The template barely changes from one to the next. A company overview, a challenge, a strategy section, and a results chart. The headline result is almost always a lead count or a traffic percentage. Read 10 of them back to back and the same gap shows up in every single one: none of them report whether the leads turned into jobs. Three numbers stay missing every time:
- No close rate on the leads the campaign produced.
- No response time on the calls and forms that came in.
- No follow-up cadence past the first attempt.
The chart measures activity at the top of the funnel and stops there.

| What the case study reports | What it leaves out |
|---|---|
| Total leads generated | How many of those leads became booked jobs |
| A traffic percentage increase | Whether any call or form was tracked to a sale |
| Ad spend and cost per lead | What each closed job actually cost |
| The channel that produced the leads | How fast anyone responded once a lead came in |
The same blind spot runs through the organic side too. A proof page for SEO for roofing contractors can show a real ranking jump and still say nothing about what happened after the phone rang. The channel changes. The missing number stays the same.
Why lead count is the wrong number to chase
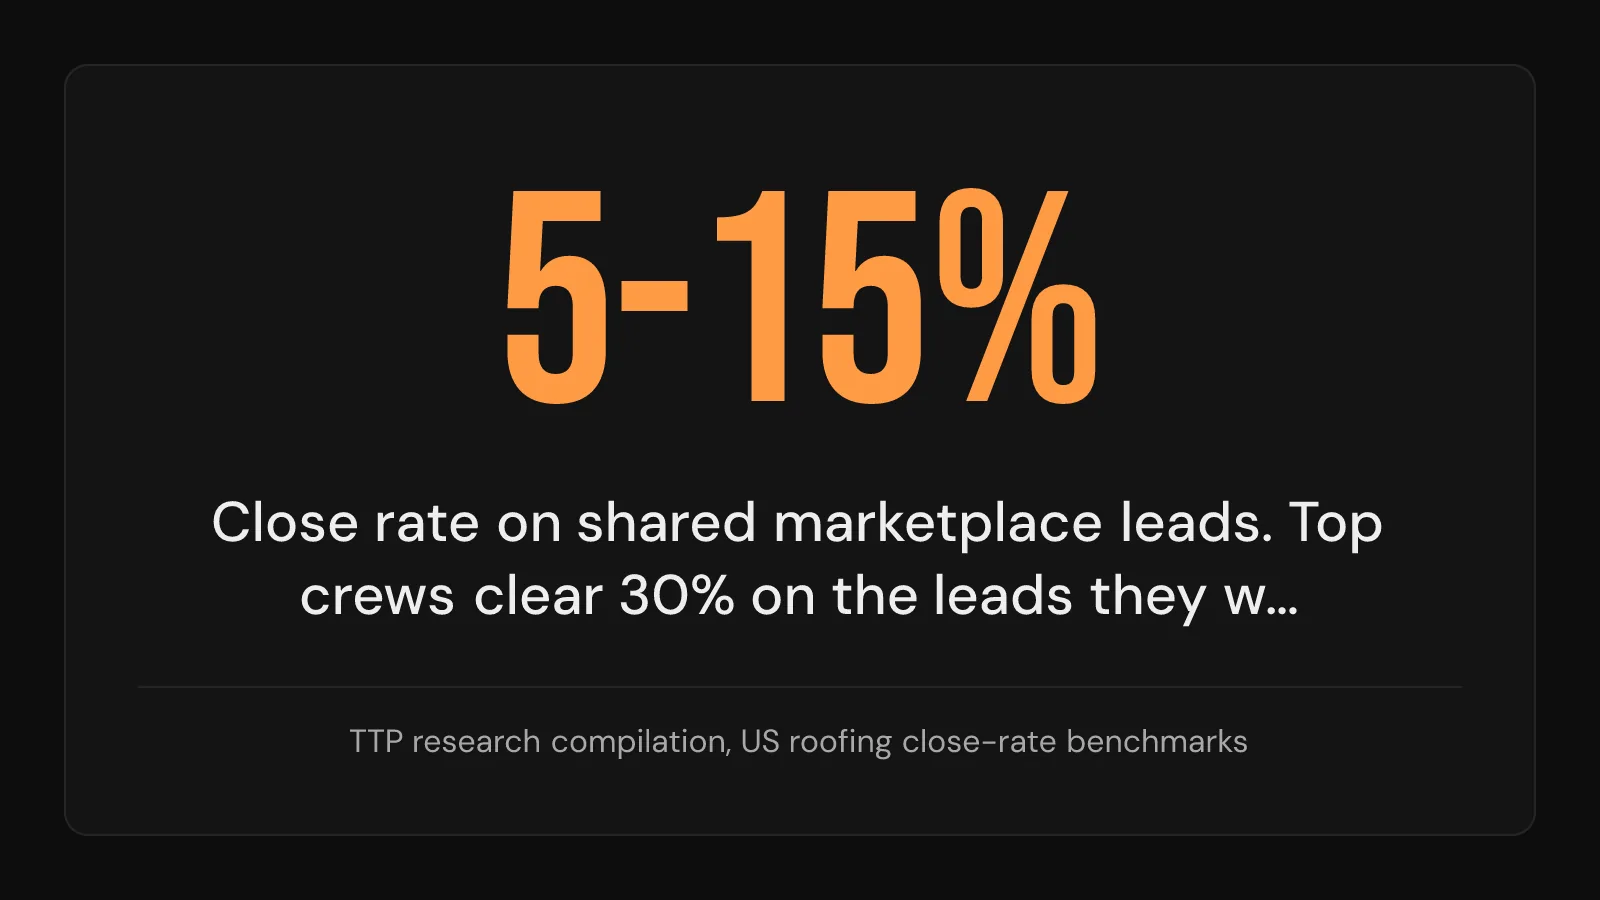
Close rate is where the story actually gets decided. The industry closes 15 to 27% of its leads. Top crews clear 30%. Shared leads from the big marketplaces close at 5 to 15%. The same 100 leads can mean five jobs or 30 jobs depending on who works them and how fast. A report that celebrates the 100 and skips the close rate has told you almost nothing about the money. The same division applied to the price side shows what roofing leads actually cost per booked job.
Here is what that gap looks like in the wild. Treat any of these as a red flag:
- Leads generated get reported and jobs closed never come up.
- A traffic percentage stands alone with no conversion tracking behind it.
- Response time on the leads is never named anywhere on the page.
- The win rides on one channel or one brand-name spike nobody can repeat.
The shared-lead marketplaces run on exactly this blindness. What shared leads really sell you is a spot in a race, and the pages selling those races never show the close rate either.
What actually decides whether a lead becomes a job
Speed comes first. Call a lead inside five minutes and you are 100x more likely to reach them and 21x more likely to qualify them than if you wait half an hour. No channel choice moves the odds like that. A homeowner submits a form, opens three tabs, and starts deciding who feels safe within minutes. The first crew she hears from owns that window.
Communication carries the rest of the decision. When two bids are close, 67% of homeowners say communication quality makes the decision. That is a stat about follow-up discipline. It says nothing about which channel produced the lead, which is exactly why case studies built on channels never mention it.
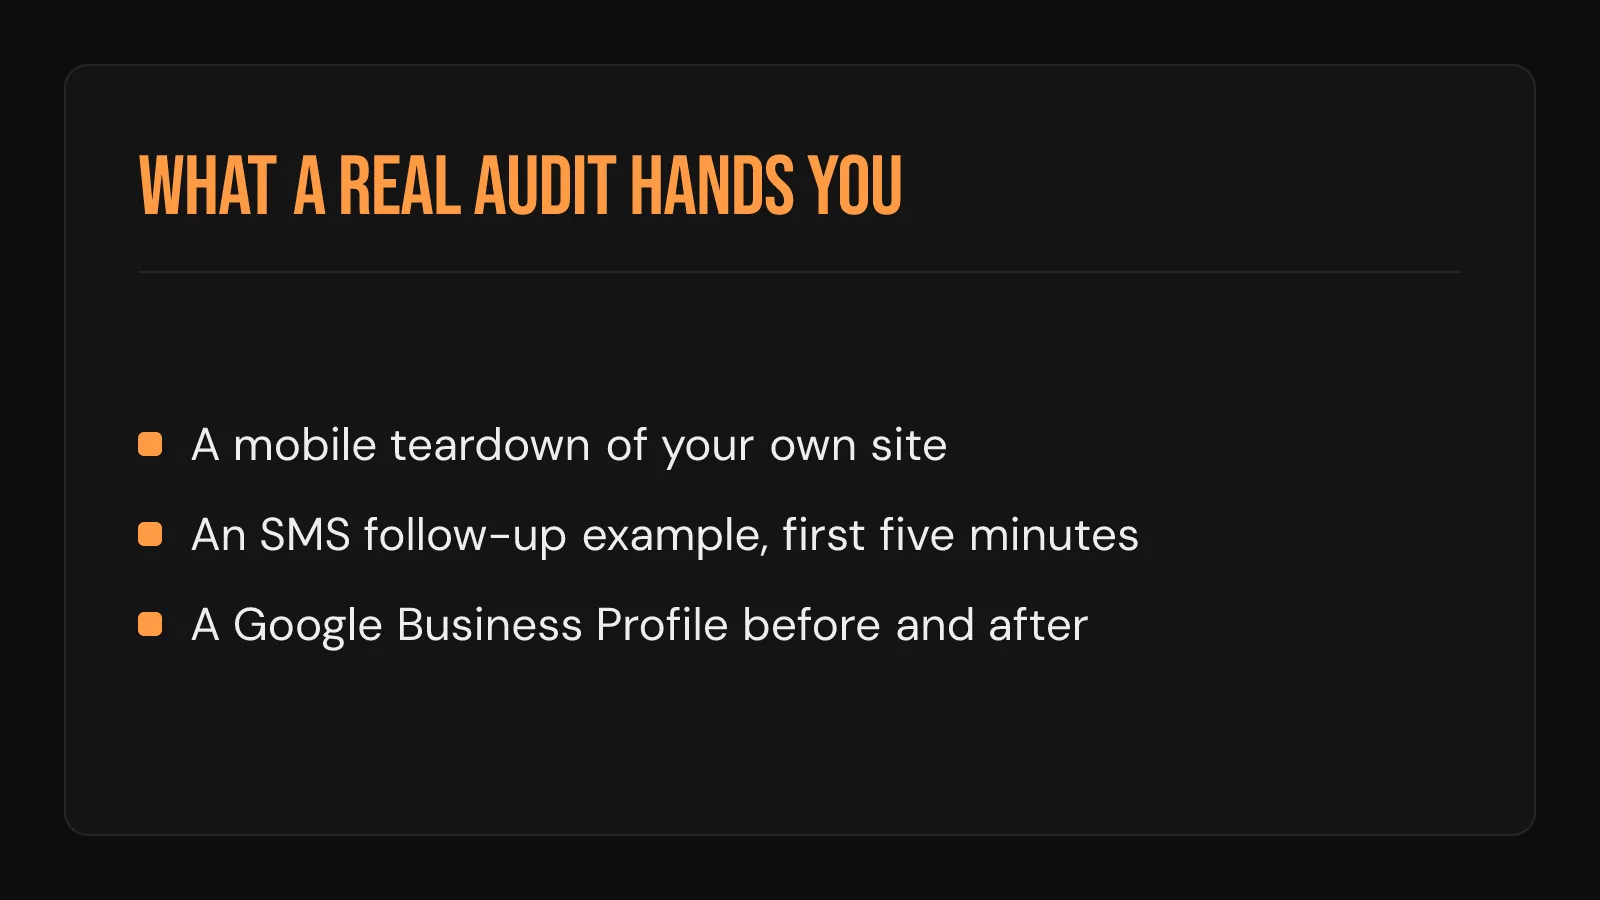
This is also the kind of evidence a real audit produces. Instead of a stranger's chart, it hands you artifacts from your own operation:
- A mobile teardown that shows where a homeowner loses confidence in the site.
- An SMS follow-up example that shows what a lead hears in the first five minutes.
- A Google Business Profile before and after that shows the gap between the profile and the crew's real work.
Why The Trust Process does not publish a lead-volume case study
The Trust Process does not run ad campaigns, manage ad spend, or sell leads. There is no lead-volume number to publish because producing volume was never the job. So this page was never going to read like most roofing leads case study pages you have seen. Anyone shopping contractor roofing leads elsewhere runs into the same absence: no volume number to buy, because volume was never the product being sold here. The work starts one step later, where leads already exist and jobs quietly go missing. The fourth layer below, search visibility, gets its own full breakdown in organic roofing leads that never enter a shared marketplace.
What gets checked instead runs in the same order every time:
- Site trust on mobile. Does the site earn a homeowner's confidence before she scrolls twice?
- Follow-up past the first reply. Does anyone stay in the conversation after Day 2?
- The Google Business Profile. Does it reflect what the crew actually does?
- Search visibility. Can the homeowners already looking for you find you?
That order matters because owning your lead pipeline starts with conversion. Fix those four layers and the math changes on every lead you already get, whatever channel it came from.
How to read any roofing marketing case study before you believe it
Take this into the next sales call that opens with a results chart. Four questions, and what a straight answer sounds like:
| The question to ask | What a real answer sounds like |
|---|---|
| What was the close rate on those leads? | A percentage with a time period attached. Silence here is the whole story. |
| How fast were the leads contacted? | Minutes. A crew that tracks response time knows it cold. |
| Which channel produced them, and were they exclusive? | A named channel. Vague sourcing usually means shared leads someone else also bought. |
| Would this repeat without the one-off spike? | An honest yes or an honest no. Real systems repeat. Lucky months do not. |
The same test works on the SEO side of the fence. How to check a roofing SEO success story walks the identical instinct through rankings and traffic claims. Different chart. Same missing starting point.
Frequently Asked Questions
Does a high lead count in a roofing leads case study actually mean good ROI?
A high lead count on its own says nothing about ROI. Shared leads from the big marketplaces close at 5 to 15%, so a report full of leads can still describe a month full of dead ends. Without a close rate next to it, a lead count is just activity.
Do AI lead-generation tools change what a case study should measure?
No, the tools only change how leads get found. What proves those leads were worth finding stays the same. Whether the source is PPC, SEO, referrals, or an AI-sourced list, response speed and follow-up decide the booked job.
Why trust a case study when the last one did not deliver real jobs?
Distrust here is common and earned. 70% of roofing companies do not trust the marketing provider they already pay. Next time, verify the two numbers the last one skipped: the close rate on the leads and the response time behind them.
Does The Trust Process publish a roofing leads case study with a lead-volume number?
No. The Trust Process does not run ad campaigns or manage ad spend, so a lead-volume number of that kind does not exist here. What exists instead is an audit of the four layers that decide whether the leads a contractor already gets become jobs: the site, the follow-up, the Google profile, and search visibility.
What is a better proof point than a lead count in a case study?
A real audit finding on your own operation beats a stranger's lead count every time. A mobile teardown, a follow-up speed check, or a Google Business Profile gap is about your numbers instead of someone else's campaign. Every one of those findings is checkable the same afternoon, and the same close rate feeds directly into marketing budget percentage for roofing companies, which sizes how much any lead-producing channel should actually get.