Marketing Budget Percentage for Roofing Companies, Explained
What is the right marketing budget percentage for roofing companies once the referrals stop covering the calendar? Most owners have heard a number tossed around at a trade show or from a vendor with something to sell, and none of it holds up once you check it against real revenue and a real close rate. This guide walks through the working range, breaks it down by channel, and shows the cost math nobody puts in writing.
The Marketing Budget Percentage for Roofing Companies That Actually Works
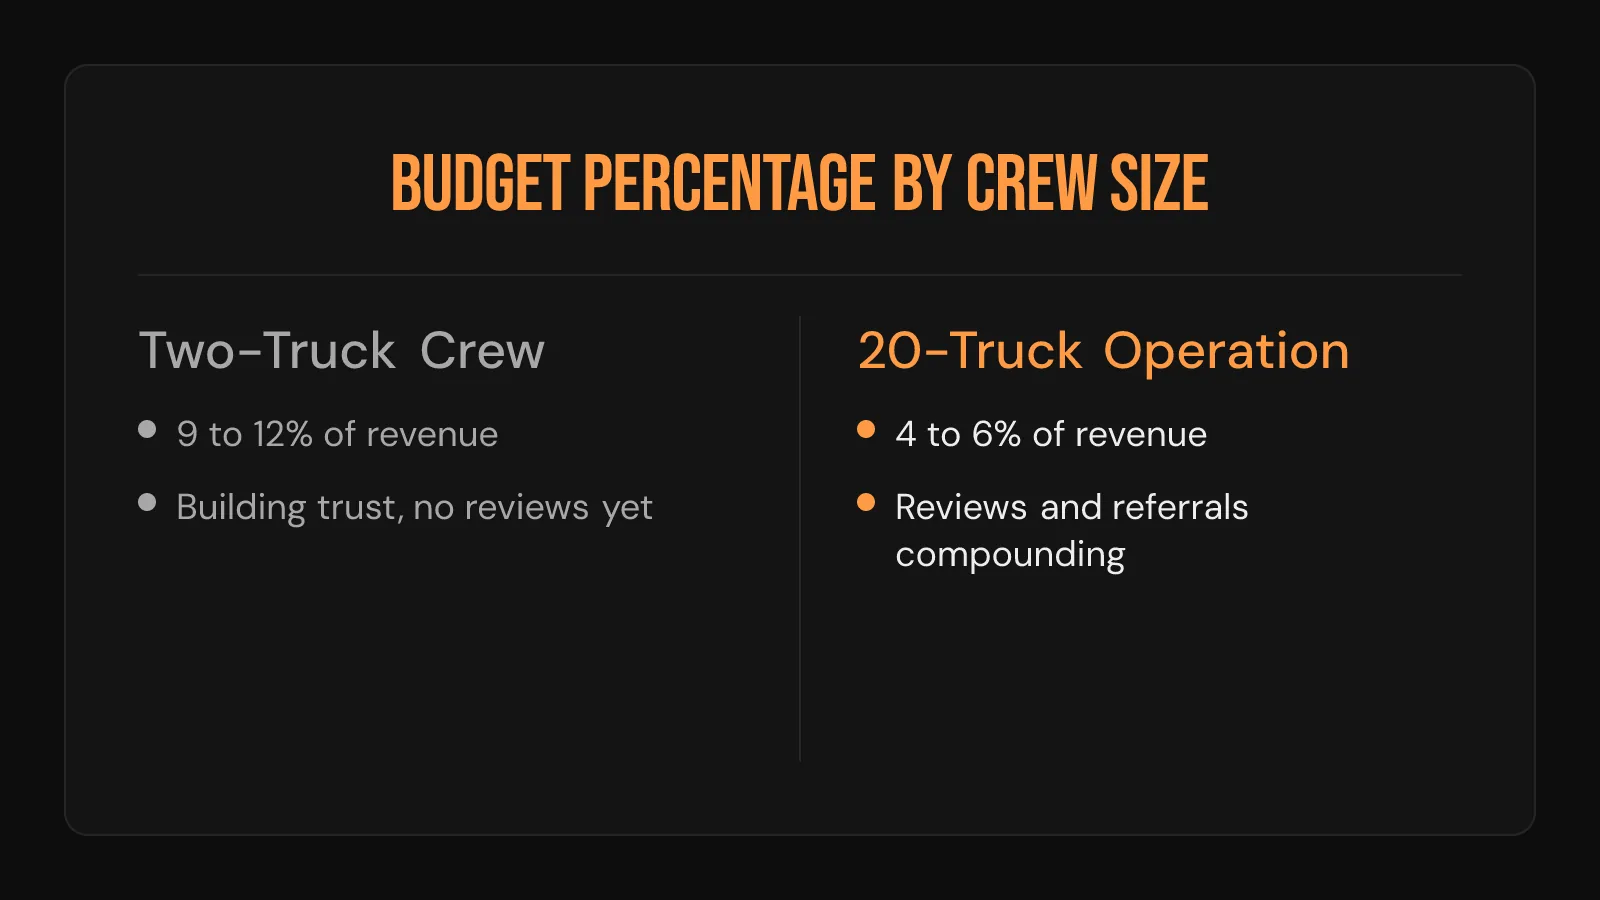
The honest answer is a range instead of a single number. Most healthy roofing companies land somewhere between five and 12 percent of revenue, once you strip out one-time website builds and count only the ongoing spend. A brand-new crew fighting for its first reviews usually sits at the top of that range. A company with 10 years of reviews and a full referral pipeline can run near the bottom. Neither number is wrong. The mistake is picking a single fixed figure and never revisiting it.
A search for the marketing budget percentage roofing companies actually use turns up wildly different answers, because most guides quoting one number never say which stage of growth it assumes. A search for the marketing budget percentage roofing contractors trust also runs into the same problem. A two-truck operation needs a very different roofing contractor marketing budget percentage than a large multi-crew operation does. The roofing contractors marketing budget percentage that fits 20 trucks looks nothing like the number a small crew should use. The roofing industry marketing budget percentage most often quoted online assumes every business is the same size, and that assumption is the whole problem.
| Revenue stage | Typical marketing budget percentage | Why it sits there |
|---|---|---|
| First two years, building trust | Nine to 12 percent | No review base yet. Every channel is paying full price for attention. |
| Established, steady referrals | Six to eight percent | Referrals and reviews are doing real work, so paid channels backfill rather than carry the load. |
| Market leader, name recognition | Four to six percent | The Google profile and reputation already convert; spend maintains position instead of building it. |
The roofing marketing budget percentage revenue conversation always comes back to that same table. The roofing marketing budget percentage of revenue that matches your stage is the real starting point, and it beats a number borrowed from a business twice your size. Some readers arrive here chasing a roofing marketing statistics or roi or budget answer instead of a plain percentage. Others come from a roofing industry marketing statistics or budget angle, hunting for a broader industry number instead of a personal one. Either way, the table above is the answer both were looking for.
Two quick signs the number needs adjusting before the next budget season:
- New-inquiry calls have slowed to a trickle. That usually means the percentage is too low for the current growth stage rather than a sign the channels are broken.
- The close rate is under 15 percent. That is a conversion problem, and no percentage increase fixes it.
Once the number is set, the next question is why a percentage works better than a flat dollar figure in the first place.
Why a Percentage Beats a Flat Dollar Budget
A flat dollar figure breaks the moment the business grows. An average residential asphalt replacement runs $9,500 to $11,500, and insurance restoration jobs run $12,000 to $15,000, so a company closing 20 more jobs a year is carrying real new revenue that a percentage automatically accounts for and a fixed number ignores. This is why the average marketing budget for roofing contractors question rarely has one clean answer online.
The average marketing budget roofing contractor guides quote is usually built for a single point in time. That single snapshot is exactly the roofing contractor marketing budget average trap: a company chasing a figure from a blog post two years old is budgeting for a business that no longer exists. The average marketing budget for roofing companies changes every year ad costs move. Roofing contractor marketing budget statistics age fast. Roofing contractor digital marketing statistics quoted in most old roundups already look thin against current ad costs.
Underspending has its own hidden costs, and none of them show up on a spreadsheet:
- Referral leakage. A roofer with no website loses an estimated $18,000 a year from referrals who searched, found nothing, and called someone else.
- Stalled compounding. A percentage set too low never lets content or local SEO reach the point where they stop costing money.
- Review drought. A thin budget usually means a thin review-request process too, and reviews are the cheapest close-rate lever on the list.
None of these ever appear in a marketing budget line item, because they are money that was never spent and never earned.
The Roofing Marketing Budget Breakdown by Channel
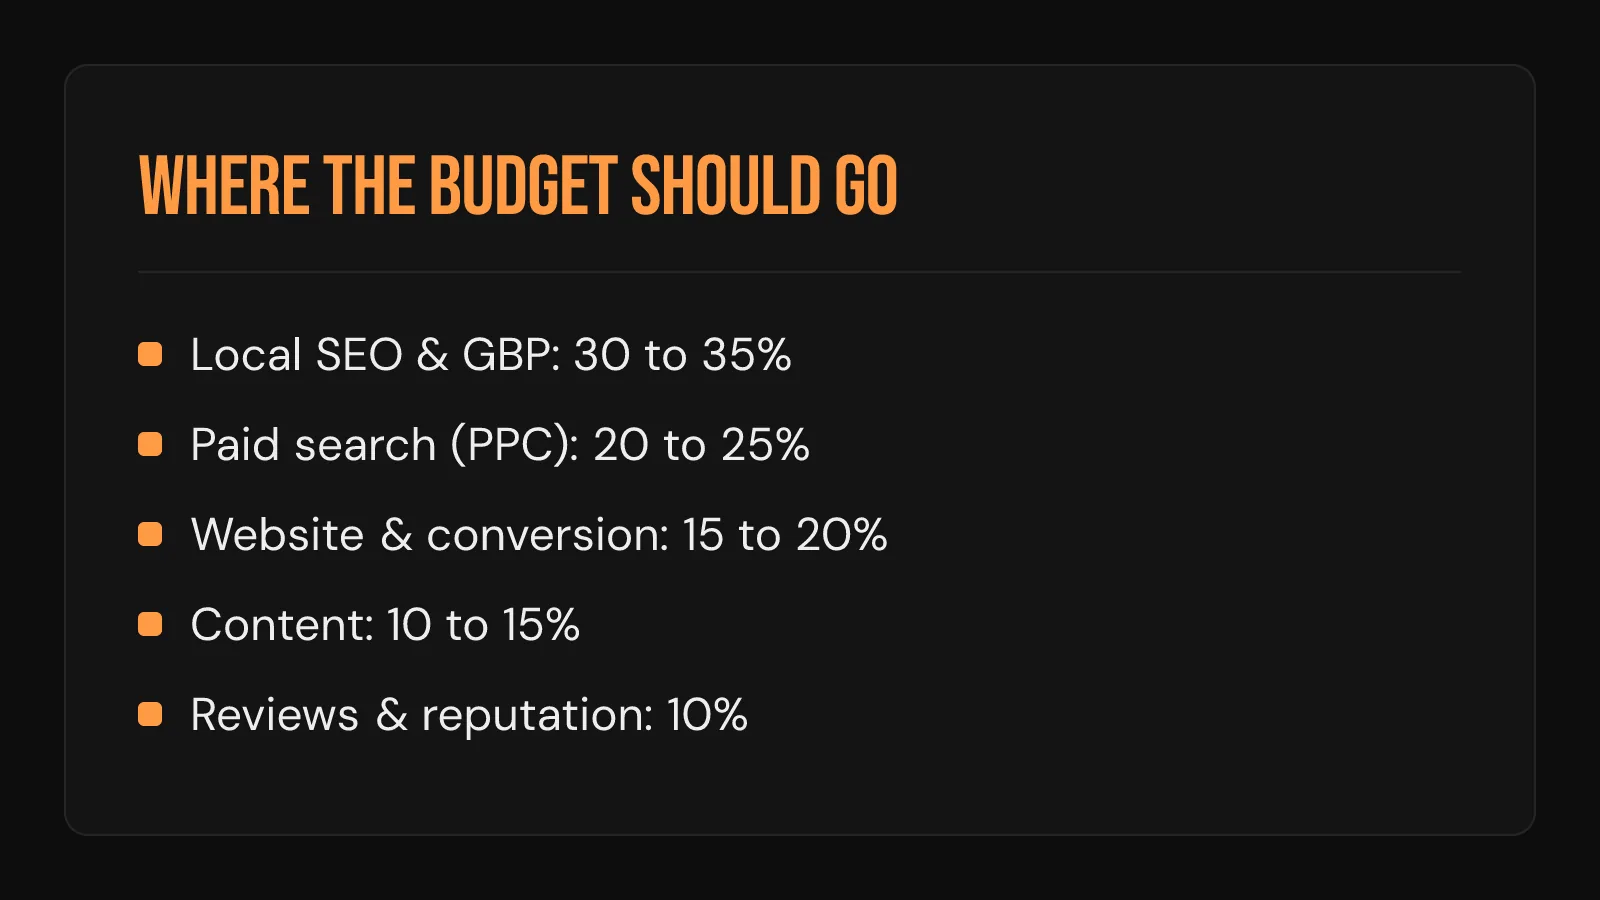
A percentage of revenue only matters once it is split across channels. Here is a working roofing marketing budget breakdown by channel for a company running a full marketing program:
| Channel | Share of the marketing budget | What it needs to do |
|---|---|---|
| Local SEO and Google Business Profile | 30 to 35 percent | Own the map pack for the neighborhoods you actually work |
| Paid search (PPC) | 20 to 25 percent | Fill the gap while organic rankings build |
| Website and conversion | 15 to 20 percent | Turn the clicks the other channels already earn into booked calls |
| Content | 10 to 15 percent | Compound traffic that stops costing money after it ranks |
| Reviews and reputation | 10 percent | Protect the close rate every other channel depends on |
The roofing marketing budget breakdown percentages above are not fixed law. A company weak on local SEO should shift its roofing marketing budget allocation percentages toward that row until the map pack actually holds. A company already dominant locally can lean harder into roofing content marketing instead, since it compounds instead of renewing every month. Either way, the marketing budget breakdown for roofing companies has to start from what is actually broken instead of from a template.
Roofing marketing statistics roi local seo comparisons consistently show the local SEO row paying back fastest for smaller companies, because the map pack is free traffic once it is held. Roofing marketing statistics roi google ads seo comparisons tell a different story for companies chasing rapid growth: paid search buys the volume that organic SEO has not caught up to yet.
A marketing budget allocation for roofing companies that ignores this order usually ends up funding the wrong row first. Roofing contractor marketing budget allocation should always start with whichever channel is currently costing the company the most missed jobs. The roofing marketing budget allocation breakdown above is only a starting point. It gets revisited every year the business changes size, and that revisit is what the roofing marketing budget breakdown allocation is really for.
What Actually Changes the Number: Growth Stage, Job Mix, and Real Results
The percentage moves for real, specific reasons. Roofing industry marketing statistics from the past two years point at the same handful of factors every time:
- A new market entry. A crew expanding into a county with no name recognition needs the top of the range instead of the middle.
- Storm season timing. A surge month justifies a short-term jump in paid spend that a calm month does not.
- Commercial versus residential mix. Commercial roofing sells on relationships more than search, so a heavier commercial book usually runs a lower percentage, which is why deciding which client segments deserve the budget comes before setting the number.
- The existing review base. A thin review count forces more paid weight. A deep one lets referrals carry a bigger share of the load.
- What the older data showed. Roofing industry marketing statistics 2023 2024 comparisons found companies with a deep review base spending less and growing faster.
- What the newer data confirmed. Roofing industry marketing statistics 2024 2025 figures held the same pattern a year later.
- Why it works this way. Roofing industry statistics 2024 marketing roundups kept repeating that finding without ever explaining the mechanism.
Close rate drives the mechanism far more than spend does. The industry closes 15 to 27% of its leads. Top crews clear 30%. Shared leads from the big marketplaces close at 5 to 15%. A business closing at the top of that range needs fewer leads, and therefore less budget, to hit the same job count.
A quick rundown of what the data actually says, once the close rate is factored in:
- Real roofing marketing statistics success stories almost always trace back to that close-rate math.
- The best roofing marketing statistics roi case studies show the close rate improving before the spend does.
- Roofing marketing roi statistics or case studies worth reading will show that close-rate assumption in plain sight.
- Roofing marketing roi examples or case studies that skip the close-rate number are usually selling something.
- Roofing marketing statistics 2024 or 2025 comparisons all point at the same close-rate mechanism.
- The roofing marketing statistics 2024 2025 figures published since have not changed that conclusion.
- A roofing marketing guide statistics roi worth trusting names its close-rate assumption up front instead of hiding it.
Cost Per Lead vs. Cost Per Customer: The ROI Math Nobody Shows You
This is where the roofing marketing statistics roi conversation actually gets useful. It also settles the roofing industry marketing statistics roi debate that never quite finishes online. A lead is not the same thing as a customer, and the gap between the two is where most budgets get judged unfairly.
| Metric | Google Ads average | Top-performer discipline |
|---|---|---|
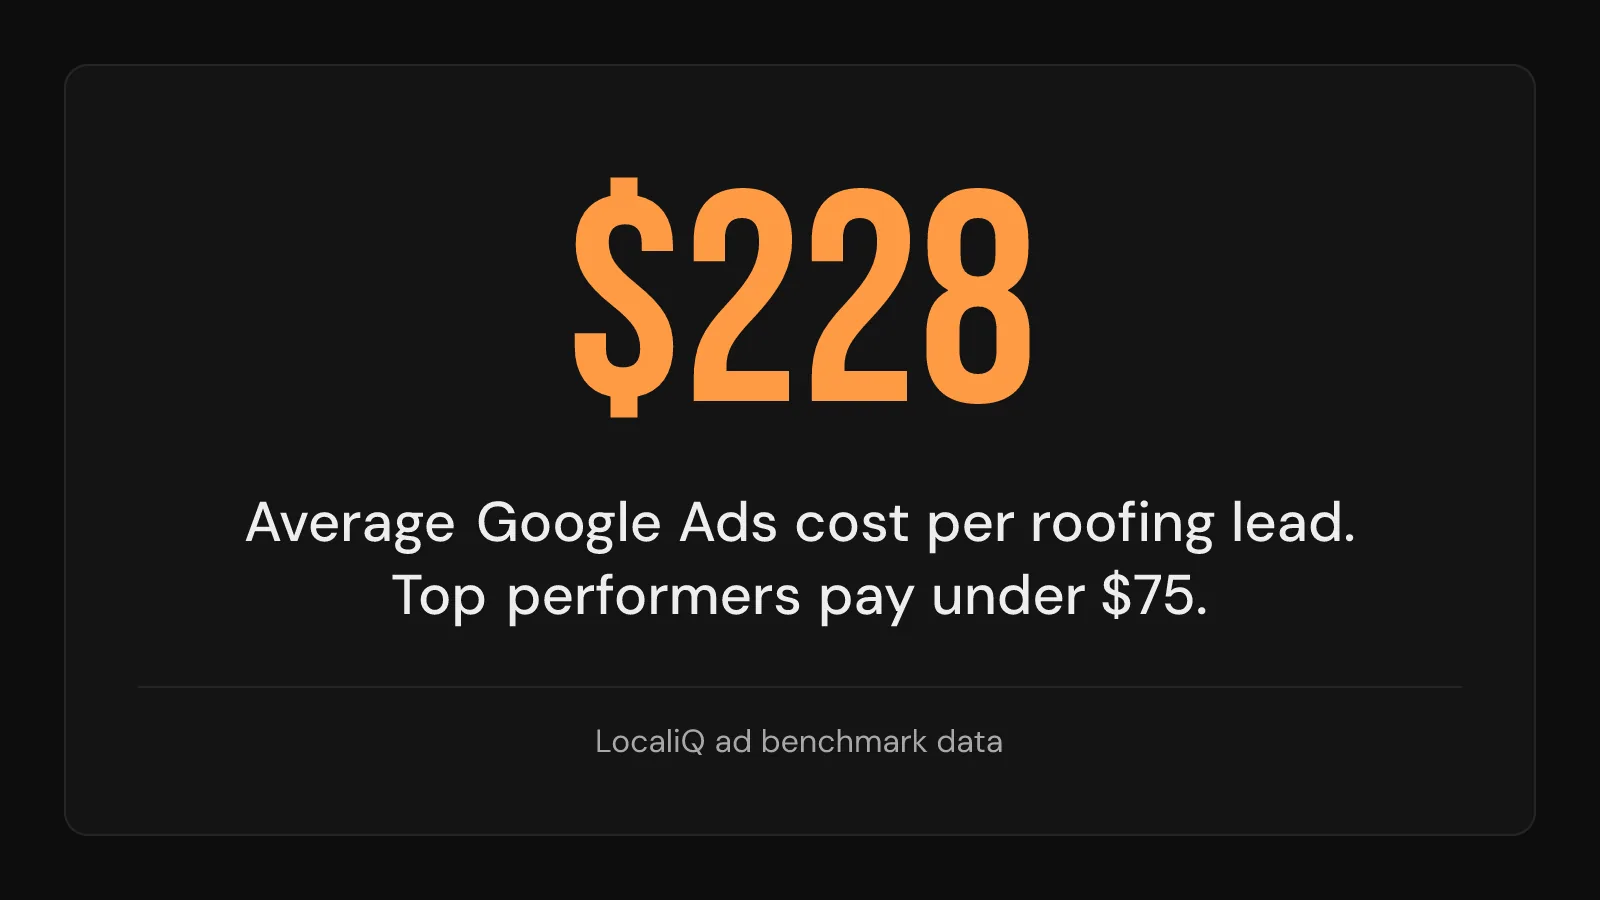
| Cost per lead | $228 | Under $75 |
| Close rate | 15 to 27% | 30% or better |
| Effective cost per customer | $844 to $1,520 | Under $250 |
Effective cost per customer is not a separately published figure. It is cost per lead divided by close rate, using the two rows above.
LocaliQ's ad benchmark data puts it plainly: a roofing lead from Google Ads averages $228, and top performers still pay under $75. Read on its own, an average cost per lead roofing marketing figure like that scares owners away from PPC entirely. Read against the close rate, the picture flips: the highest ROI marketing for roofing contractors comes from the channel with the best cost per lead once you divide by an honest close rate. A cheap lead that rarely closes still costs more in the end than a pricier lead that closes often.
Where most of these conversations stop short, and where the real number actually lives:
- Roofing marketing statistics roi leads discussions usually stop at the $228 number and never finish the math.
- Roofing marketing statistics roi lead generation comparisons rarely mention that a shared marketplace lead can look cheaper and still cost more per customer once its close rate is factored in.
- Roofing marketing statistics roi leads generation breakdowns confirm the same conclusion.
- The roofing marketing statistics roi leads 2024 figures agree: cost per booked job is the number that matters, since it is the only figure that accounts for how many of those leads actually turn into paid work.
- Roofing marketing statistics roi home services benchmarks outside roofing tell the same story.
- Roofing marketing statistics cost per lead roi comparisons inside the trade agree with them.
- Average cost per lead roofing marketing 2024 figures moved the dollar amount from the year before.
- The average cost per lead roofing marketing 2025 numbers that replaced them moved it again, and the underlying math never changed.
Roofing marketing statistics lead generation only earns its budget when someone runs this division. A roofing contractor marketing budget roi conversation that skips it is really just a guess. Call it a roofing contractor marketing budget or roi conversation instead. The math is identical either way.
Before You Raise the Percentage, Fix Conversion First
Here is the honest-take part of this guide. Roofing marketing statistics roi best practices content almost never says this, because it does not sell more ad spend: raising your marketing budget percentage before fixing conversion just means paying more to lose the same leads.
A roofing contractor marketing statistics roi review that only looks at spend is looking at the wrong variable. A roofing contractor marketing statistics or roi audit that actually helps checks the same three things every time, in this order:
- The website. Does it earn trust on a phone screen in the first few seconds, before a single ad dollar sends anyone there?
- The follow-up. Does a form or missed call get a reply inside five minutes, every time, including nights and weekends?
- The Google profile. Does it show real job photos, current hours, and a review count that matches the crew's actual work?
Those three decide what happens to every lead the budget above already bought.
| Approach | What happens next | What it actually fixes |
|---|---|---|
| Raise spend, skip the audit | More leads hit the same broken funnel | Nothing. The leak only gets bigger. |
| Fix conversion, then raise spend | The same lead count books more jobs | The percentage now has something solid to multiply |
Where the trend-chasing content usually goes wrong:
- Roofing contractor marketing statistics or trends pieces love to chase what is new.
- Roofing contractor marketing statistics trends coverage rarely mentions that the oldest fix, answering the phone fast, still outperforms most new channels.
- Roofing marketing statistics or roi or trends debates miss a simple point: a trend is worthless if the site it sends traffic to does not convert.
- Roofing marketing statistics or trends or roi arguments miss the exact same point from the opposite direction.
- Roofing marketing statistics trends roi figures assume conversion is already fixed.
- The roofing marketing statistics roi trends numbers cited alongside them make the same assumption, and neither one questions whether the website was ever built to earn trust in the first place.
Roofing industry marketing statistics roi research says the same thing every year: contractors who want ad spend before fixing conversion are the ones who end up feeling like the marketing "didn't work," when the leak was never the budget.
Owning that math is also the difference between buying roofing leads and buying a percentage nobody can account for. A budget that funds a broken funnel is a conversion problem wearing a marketing budget's clothes. Fixing it means a deliberate plan for how to increase conversion on roofing leads before the percentage moves. Getting the marketing budget percentage for roofing companies right only pays off once that funnel is fixed. The same math is worth running before signing with any roofing leads company: the invoice is easy to see, and the close rate behind it rarely is.
Frequently Asked Questions
Does the 70/20/10 marketing budget rule work for roofing companies?
The 70/20/10 rule, 70 percent on proven channels, 20 percent on channels showing early promise, 10 percent testing something new, translates reasonably well to roofing once "proven" means local SEO and reviews rather than a national ad platform. Most roofing companies should keep the experimental 10 percent small until the proven 70 percent is actually converting.
Does the 60/40 marketing budget split apply to roofing marketing?
The 60/40 split, 60 percent on channels that build long-term visibility and 40 percent on channels driving immediate response, maps cleanly onto roofing: local SEO and content take the 60, paid search and direct outreach take the 40. Roofing companies leaning too far toward the 40 usually run out of budget before the 60 ever compounds.
What percentage of revenue should a roofing company spend on marketing?
Most roofing companies should plan on five to 12 percent of revenue for marketing, with newer companies at the top of that range and established companies with a strong review base at the bottom. The right number inside that band depends on growth stage, review count, and how much of the work already comes from referrals.
How does a roofing company's profit margin affect how much it can spend on marketing?
Most roofing companies run on thin net margins as a general rule, with very little room to absorb a marketing spend that does not pay back. That thin margin is exactly why the percentage should track revenue rather than a fixed dollar target set once and forgotten, since every marketing dollar has to be judged against the close-rate math above.
Is it worth raising your marketing budget if your last provider never proved ROI?
Raising the budget before understanding why the last provider could not prove ROI usually repeats the same outcome with a bigger number attached. Most contractors who feel burned were paying for activity: posts, ad clicks, a monthly report. The fix is demanding the close-rate math above before any new spend rather than simply spending more with someone new.
Should you increase ad spend or fix your website's conversion rate first?
Fix conversion first, always. Raising ad spend into a website that does not earn trust on mobile, a phone that goes unanswered after hours, or follow-up that dies after day two just buys more leads for the same leak to swallow. Every dollar spent on new traffic before that gets fixed is a dollar spent proving the leak still works.